

In my last article, I talked about Chrome Extension and Architecture and how it works. I also promised that my next article would be on building a Chrome Extension as a mini project. So, yeah we are now going to build a chrome extension from scratch !! 🎉 🎉
Basics of chrome extension
Let me give you a quick recap about chrome extension. Chrome extensions are just combination of HTML, CSS and JavaScript files combined together with a manifest.json file. manifest.json describes the details about the extension and tells which JavaScript files performs which functions.
Demo of our project
 Our extension will have a popup which will display all the statistics and a live count bar on YouTube homepage. We are going to use ApexCharts.js for building the bar graph. Even if we close the YouTube page, the count value is stored by the extension, so it can restart its count, when YouTube page is opened again. It also remembers the day, so it can initialize the count to zero when a new day is started.
Complete build project is available on Github
Let's start building 🔥
Our extension will have a popup which will display all the statistics and a live count bar on YouTube homepage. We are going to use ApexCharts.js for building the bar graph. Even if we close the YouTube page, the count value is stored by the extension, so it can restart its count, when YouTube page is opened again. It also remembers the day, so it can initialize the count to zero when a new day is started.
Complete build project is available on Github
Let's start building 🔥
Building the extension
First of all, create a folder, we will create all our HTML and JavaScript files here. Let's start with our manifest.json.
1. manifest.json
Create a JSON file with the name manifest.json, like I said before it describes the information about our extension architecture and permissions required. So, create the file with following starter code:
{
    "manifest_version":3,
    "name":"YouTube Timer",
    "version":"1.0",
    "description":"This extension lets you measure time spent on youtube",
    "author":"Your name here"
}
You are always welcome to change the name and description if you want. We need to mention the details of our extension architecture, for that we need to analyze our requirements from the extension.
Our requirements for the extension are:
Activate and display live timer only on YouTube page.
Store the timer value when user exits YouTube Page.
Display a popup with chart for visualization.
For our first requirement, we need a content script. content script is a file which runs in the context of current matched web page. Let's break that down.
context means the content script has access to webpage's HTML tree, therefore we can apply our DOM manipulations. Since, we need to run a content script add content_scripts property to our manifest.json. To mention the JavaScript file, inside content_scripts, create a key js and add an array with our script.js element.
matched refers to the websites on which our content script to run. It is defined by matches in manifest.json file, It is an array of strings which also accepts regular expressions. Since, we need to display counter on YouTube page, let's add YouTube links.
Now let's modify our manifest.json file indicating our change:
{
    "manifest_version":3,
    "name":"YouTube Timer",
    "version":"1.0",
    "description":"This extension lets you measure time spent on youtube",
    "author":"Your name here",
    "content_scripts":[
        {
            "matches":["http://www.youtube.com/*","https://www.youtube.com/*"],
            "js":["script.js"]
        }
    ]
}
For our second requirement, we need to ask the user for storage permissions, so add new key to our manifest.json, "permissions" which is a array listing the permissions required. Add "storage" to our permission array.
"permissions":[
        "storage"
  ]
For our third requirement, we need to read users action and provide output, if the user clicks on our extension icon, then we need to display HTML page with charts, we also need icons to display our extension on the extension toolbar.
For that we need to modify our manifest.json and add a key named action which itself is an object which contains, default_popup, this stores the address of HTML page to displayed, default_title, this stores the content to be displayed when user hovers over the extension icon and lastly icons which stores the value of icons to be displayed in different sizes.
To adds icons and the know about the required sizes, read my article, where I have described about icons. SInce, icons are optional, if you don't want to create icons, you can just remove them from manifest.json decleration.
Our final manifest.json after all modifications looks like this:
{
    "name":"YouTube Timer",
    "description":"This Chrome extension lets you measure time spent on youtube",
    "version":"1.0",
    "manifest_version":3,
    "action":{
        "default_popup":"index.html",
        "default_title":"YouTube Timer shows you time spent on YouTube.",
        "default_icon": {
            "16": "Yt.png",
            "32": "Yt.png",
            "48": "Yt.png",
            "128": "Yt.png"
          }
    },
    "permissions":[
        "storage"
    ],
    "content_scripts":[
        {
            "matches":["http://www.youtube.com/*","https://www.youtube.com/*"],
            "js":["script.js"]
        }
    ]
}
2. script.js
script.js is used as content scripts which manages the live counting and displaying it on the YouTube page. First things first, how will we display timer on the YouTube page. Well, with the help of our good old DOM.
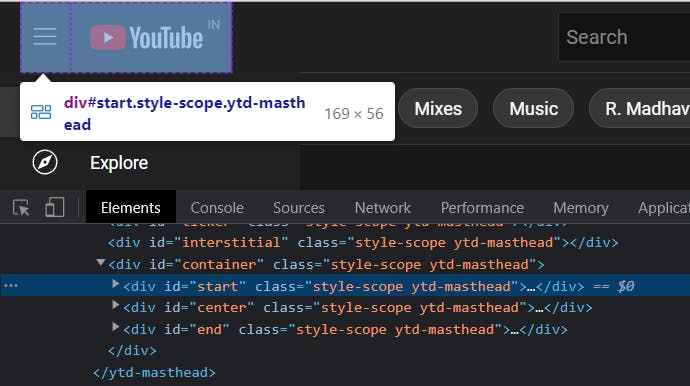
So, create a function called starter() which will create a h2 element, sets id to the element and modify its content and style. It will also select the YouTube page's navbar and appends the newly created h2 element.
Our script.js file looks like this after adding the function:
function starter(){
    let starts = document.querySelector("#start");
    let child = document.createElement("h2");
    child.setAttribute("id","timer-func");
    child.innerText = " s";
    child.style = "color:#fff";
    starts.append(child);
}
Note: Selecting the correct navbar element was little tricky, so I directly added the code for that. You can also play around to select element by experimenting with above code.
Now we need to create a function to increment count value, we can do this easily using a setInterval method, with a 1000ms interval. In this one second, we will increment count, check if the time can be expressed in seconds, minutes or hours and add the required statement to be displayed in the newly created element inside YouTube's navabar.
Our script.js file looks like this after modification:
let todayCount=0;
setInterval( () =>{
            let child = document.querySelector("#timer-func");
            let hours, min, seconds;
            if(window.closed) {
                clearInterval(timer);
            }
            else{
                todayCount++;
                hours = Math.floor(todayCount/3600);
                min = Math.floor((todayCount - hours*3600)/60);
                seconds = Math.floor(todayCount - (min*60+hours*3600));
            }
            let result = " ";
            if(hours>0)
                result = hours + " Hr " + min+" min "+seconds+" s ";
            else if(min > 0)
                result = min+" min "+seconds+" s ";
            else
                result = seconds+" s ";
            child.innerHTML = result;
        }, 1000);
Now let us take a slight detour from our script.js file to learn how to load our extension, this will helps us debug any errors in between.
1.Open your browser and on address bar paste this link chrome://extensions/ (works on both Google Chrome and Brave)
2.On the top right corner, turn on 'Developer Mode`, this will activate three buttons on the left.
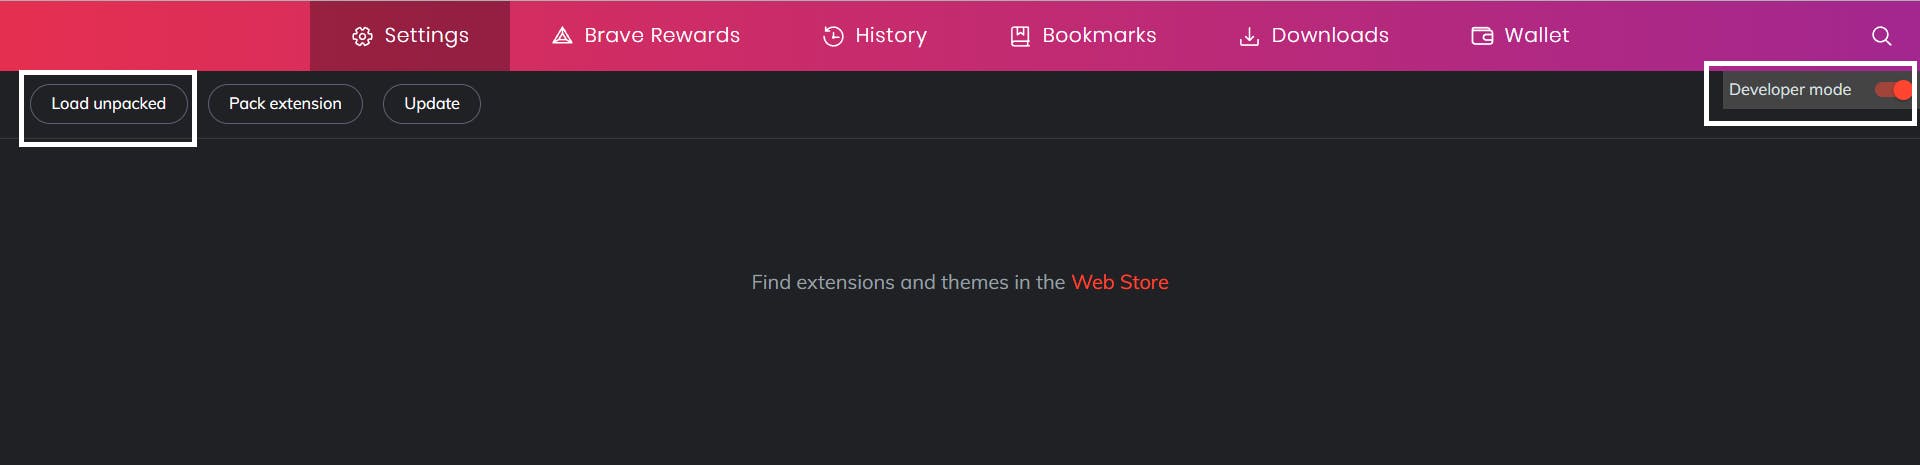
3.Click Load Unpacked, and select the folder where you have stored the extension files. Don't forget to pin the extension in extension toolbar.
4.Now open YouTube website, voila you just created a working extension which displays timer alongside YouTube logo.

Now you can see a problem here, whenever you reload a page, the count returns to zero and there is no mechanism to store todayCount's value. Also, you cannot know which day is today. To solve this problem we are going to create an array of 7 values, each representing a day in the week.
To store the count values we are going to maintain an array storageArr, which will hold the count values of 7 days. We can use the method chrome.storage.local.set to store the values. We also need to add an event listener, which will trigger when user exits the webpage. This event is described by beforeunload.
Modifying our script.js file:
window.addEventListener('beforeunload', function () {
            // Array to store count and today denotes index
            storageArr[today]=todayCount;
            chrome.storage.local.set({'arrWeek':JSON.stringify(storageArr)},function(){
            });
        });
Let's further explore the above code, we have added an event listener, we have called the chrome.storage.local.set method. This method is described in chrome documentation. This method takes two arguments, one is the key and its value. Here, key is arrWeek and Value is Stringified array.(chrome.storage.local.set method takes key value pairs in form of strings only). We can also provide a callback to this function. Providing call back is optional here.
Our script.js can display count on YouTube page, it can store the value in storage provided by chrome, but we haven't added a method to retrieve data from the storage. For that we are going to use chrome.storage.local.get method. This method is an asynchronous method. Hence we are going to use Promises to get the value and use error handling also.
let getLocalStorageValue = (key) => {
    return new Promise((resolve, reject) => {
        try {
            chrome.storage.local.get(key, function (value) {
                resolve(value);
            })
        }
        catch (ex) {
            reject("Unexpected error occurred: "+ex);
        }
    });
}
I have declared a function named getLocalStorage which returns a promise object. We have also added try and catch block to handle errors if any. If no error occurs then we are going to resolve the promise.
By resolving the promise were passing the stored value into an arrow function, which will check if the value is stored or not. If the value was not stored then the extension is being run for the first time, hence will store arrays of zero in storageArr, if the value was stored, then we will parse it using the JSON.parse function.
Script.js modified to resolve the promise:
let storageArr = undefined;
getLocalStorageValue("arrWeek")
    .then((value)=>{
        storageArr = value;
            if(storageArr.arrWeek!=undefined)
                storageArr = JSON.parse(storageArr.arrWeek);
            else{
                storageArr.arrWeek = [0,0,0,0,0,0,0];
                storageArr = storageArr.arrWeek;
            }
            if(storageArr==undefined)
                storageArr = [0,0,0,0,0,0,0];
        let today = new Date().getDay();
        let todayCount = 0;
        todayCount = parseInt(storageArr[today]);
});
Since, we have declared and stored storageArr values in the resolve function, all the other functions need to be called from the resolving function to get correct storageArr value ( Asynchronous Headache!).
Therefore modifying for the above condition, the final script.js code consists:
let getLocalStorageValue = (key) => {
    return new Promise((resolve, reject) => {
        try {
            chrome.storage.local.get(key, function (value) {
                resolve(value);
            })
        }
        catch (ex) {
            reject("Unexpected error occurred: "+ex);
        }
    });
}
let storageArr = undefined;
getLocalStorageValue("arrWeek")
    .then((value)=>{
        storageArr = value;
            if(storageArr.arrWeek!=undefined)
                storageArr = JSON.parse(storageArr.arrWeek);
            else{
                storageArr.arrWeek = [0,0,0,0,0,0,0];
                storageArr = storageArr.arrWeek;
            }
            if(storageArr==undefined)
                storageArr = [0,0,0,0,0,0,0];
        let today = new Date().getDay();
        let todayCount = 0;
        todayCount = parseInt(storageArr[today]);
        starter();
        setInterval( () =>{
            let child = document.querySelector("#timer-func");
            let hours, min, seconds;
            if(window.closed) {
                clearInterval(timer);
            }
            else{
                todayCount++;
                hours = Math.floor(todayCount/3600);
                min = Math.floor((todayCount - hours*3600)/60);
                seconds = Math.floor(todayCount - (min*60+hours*3600));
            }
            let result = " ";
            if(hours>0)
                result = hours + " Hr " + min+" min "+seconds+" s ";
            else if(min > 0)
                result = min+" min "+seconds+" s ";
            else
                result = seconds+" s ";
            child.innerHTML = result;
        }, 1000);
        window.addEventListener('beforeunload', function () {
            storageArr[today]=todayCount;
            chrome.storage.local.set({'arrWeek':JSON.stringify(storageArr)},function(){
            });
        });
    });

function starter(){
    let starts = document.querySelector("#start");
    let child = document.createElement("h2");
    child.setAttribute("id","timer-func");
    child.innerText = " s";
    child.style = "color:#fff";
    starts.append(child);
}
Now even if you reload the page, the count begins by taking the stored value as starting point. This extension is actually complete!! This extension can store todayCount's value, it will reset the count to zero when a new day starts. But it will not show the cool graphs which will help user take more action in his time :(
So, let's implement the popup whenever user clicks on the extension icon.
If you are not familiar with Promises, I would recommend you to read this well written article.
3. index.html
index.html is used to display the statistics when the user clicks on the extension icon in the extension toolbar. Add index.html with the boiler plate code:
// index.html
<!DOCTYPE html>
<html lang="en">
<head>
    <meta charset="UTF-8">
    <meta http-equiv="X-UA-Compatible" content="IE=edge">
    <meta name="viewport" content="width=device-width, initial-scale=1.0">
    <title>Document</title>
</head>
<body>

</body>
</html>
First create a <div> with id container, we will add all our text content here.
In our demo, we had one heading, let's add that first. Go ahead and add <h1> with text
"YouTube Weekly Watch Data" inside our <div>. We can also see, data is displayed in form of chart for that we need to import ApexCharts.js.
ApexCharts is an MIT-licensed open source charting library. I find it simple yet powerful library. We are going to use it for our project.
Go to ApexCharts website and click on download. Unzip the downloaded file and navigate through the folder ./apexcharts-bundle/dist copy the apexcharts.js file and paste it in our extension folder. Add a script tag in our body with src pointing to location of apexcharts.js.
Google chrome does not allow HTML files with script code in them, hence we need to create another JavaScript file main.js, which will read data and build bar graphs. So, create this main.js file and add it as <script> source in the HTML body.
Our modified HTML code:
<!DOCTYPE html>
<html lang="en">
<head>
    <meta charset="UTF-8">
    <meta http-equiv="X-UA-Compatible" content="IE=edge">
    <meta name="viewport" content="width=device-width, initial-scale=1.0">
    <title>Document</title>
</head>
<body>
    <div id="container">
        <h1>YouTube Weekly Watch Data</h1>
    </div>
    <script src="./apexcharts.js"></script>
    <script src="./main.js"></script>
</body>
</html>
You can now click on the extension icon to show the done changes:
4. main.js
We are now in our last stretch, we just need to add charting functionality using apexcharts.js. You might have already guessed the first step, Yes, first step is to retrieve data from the storage. For the data retrevial we can use the already used getLoaclStorageValue function. Since, we need to run this function every time user clicks on the icon we can add window.add function to load it.
window.onload = function(){
let getLocalStorageValue = (key) => {
    return new Promise((resolve, reject) => {
        try {
            chrome.storage.local.get(key, function (value) {
                resolve(value);
            })
        }
        catch (ex) {
            reject("Unexpected error occurred: "+ex);
        }
    });
}
}
Since the getLocalStorageValue deals with asynchronous function, we can call .then() with a callback to resolve the output. Output here is the value for the key arrWeek same as in script.js file.
We have to add two functionality using main.js:
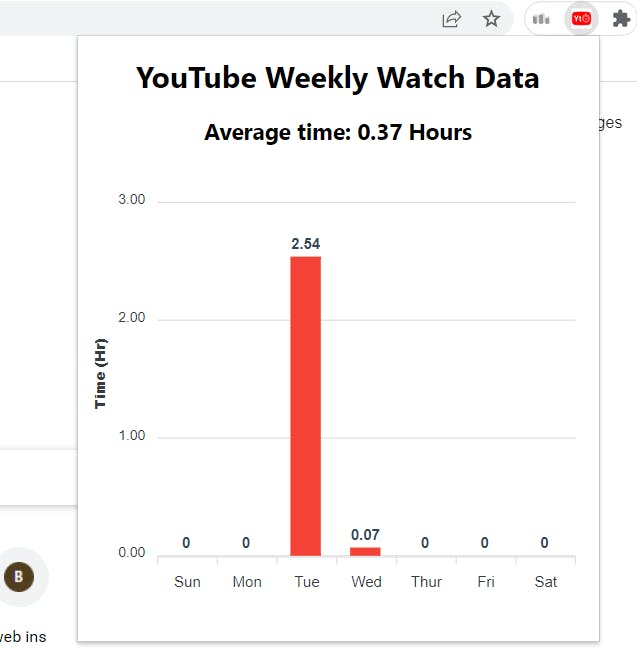
1.Display the average time taken
2.Display the graph using apexchart.js
To get the average value and to add it popup, we are going to create a function adder
let starter = (sum, string) =>{
        let avg = sum/7;
        avg = Math.round((avg + Number.EPSILON) * 100) / 100;
        let h2ele = document.createElement("h2");
        let text = document.createTextNode("Average time: "+avg+" "+string);
        h2ele.appendChild(text);
        const element = document.getElementById("container");
        element.appendChild(h2ele);
        document.querySelector("h2").style["text-align"] = "center";
    }
In this function, we are creating a h2 element and add it to popup, also based on the input to it, we will display either minutes or hours. This adds h2 element which shows the average time spent on YouTube.
Now we have to chart the data, for that we need to add a div in index.html with id of your choice.
<div id="chart" style="max-width: 650px; margin: 15px auto; min-height: 350px;"></div>
In main.js create an object of class ApexCharts, its constructor takes DOM element and options as parameter. Dom element here is the div with id="chart", options is a JavaScript object which specifies how our bar graph should be drawn.
It has various entries, first entry color describes a palette of colors for the graph, series denotes the data to be plotted, chart describes the type of graph to be plotted and its dimensions, plotOptions describe how the graph should be plotted, dataLabels denotes how labels on top of each bar should be formatted, xaxis and yaxis denotes what should be plotted on X and Y axis, fill reperesnets the opacity of the graph and finally tooltip options let's us format the tool tip of the graph, for our graph, I have disabled it.
After describing the options for the graph, we can finally plot the graph by calling the chart.render() method
Similarly like script.js, we will call all these methods while resolving the promise from getLocalStorageValue, final code after all modifications:
window.onload = function () {
    let getLocalStorageValue = (key) => {
        return new Promise((resolve, reject) => {
            try {
                chrome.storage.local.get(key, function (value) {
                    resolve(value);
                })
            }
            catch (ex) {
                reject("Unexpected error occurred: "+ex);
            }
        });
    }
    let starter = (sum, string) =>{
        let avg = sum/7;
        avg = Math.round((avg + Number.EPSILON) * 100) / 100;
        let h2ele = document.createElement("h2");
        let text = document.createTextNode("Average time: "+avg+" "+string);
        h2ele.appendChild(text);
        const element = document.getElementById("container");
        element.appendChild(h2ele);
        document.querySelector("h2").style["text-align"] = "center";
    }
    let storageArr = undefined;
    getLocalStorageValue("arrWeek")
        .then((value)=>{
            storageArr = value;
            if(storageArr.arrWeek!=undefined)
                storageArr = JSON.parse(storageArr.arrWeek);
            else{
                storageArr.arrWeek = [0,0,0,0,0,0,0];
                storageArr = storageArr.arrWeek;
            }
            if(storageArr==undefined)
                storageArr = [0,0,0,0,0,0,0];
            let max = Math.max(...storageArr);
            let hours, min, seconds;
            hours = Math.floor(max/3600);
            min = Math.floor((max - hours*3600)/60);
            seconds = Math.floor(max - (min*60+hours*3600));
            let label = undefined;
            let label2 = undefined;
            console.log(max);
            let modifiedArr;
            if(hours>0){
                let sum = 0;
                label = 'Time (Hr)';
                label2 = "Hr";
                modifiedArr = storageArr.map(function(num){
                    num = (num/3600);
                    num = Math.round((num + Number.EPSILON) * 100) / 100;
                    sum += num;
                    return num;
                })
                starter(sum,"Hours");
            }
            else if(min > 0){
                let sum = 0;
                label = 'Time (min)';
                label2= 'min';
                modifiedArr = storageArr.map(function(num){
                    num = (num/60);
                    num = Math.round((num + Number.EPSILON) * 100) / 100;
                    sum += num;
                    return num;
                })
                starter(sum,"Minutes");
            }
            else if(seconds>=0){
                label = 'Time (s)';
                label2 = 'seconds';
                modifiedArr = storageArr;
            }
            var options = {
                colors:['#F44336'],
                series: [{
                    data: modifiedArr
                }],
                chart: {
                    type: 'bar',
                    height: 350,
                    width:400,
                    toolbar:{
                        show:false
                    }
                  },
                plotOptions: {
                    bar: {
                      horizontal: false,
                      columnWidth: '55%',
                      endingShape: 'rounded',
                      dataLabels: {
                        position: 'top',
                      }
                    },
                },
                dataLabels: {
                    enabled: true,
                    formatter: function (val) {
                      return val;
                    },
                    offsetY: -20,
                    style: {
                      fontSize: '12px',
                      colors: ["#304758"]
                    }
                  },
                xaxis: {
                    categories: ['Sun','Mon','Tue','Wed','Thur','Fri','Sat'],
                },
                yaxis: {
                    title: {
                      text: label
                    }
                },
                fill: {
                    opacity: 1
                },
                tooltip: {
                    enabled:false,
                  }
                };
            var chart = new ApexCharts(document.querySelector("#chart"), options);
            chart.render();
        })
}
Save the file and click on extension icon, you're extension popup might look like this now:
Note: If you are not familiar with
ApexCharts, I would highly recommend you to check out there nicely written documentation.
Yes, that's it you have just created a working chrome extension. This only works on your browser, to share your cool work with your friends, you can share it on github or publish it on Chrome Web Store!!
Also feel free to modify my code to your liking, you can add custom CSS to make it look more cool. I hope after reading this blog, you will create some cool extensions of your own!
Happy coding!!
If you want to connect with me, you can find me on Twitter