


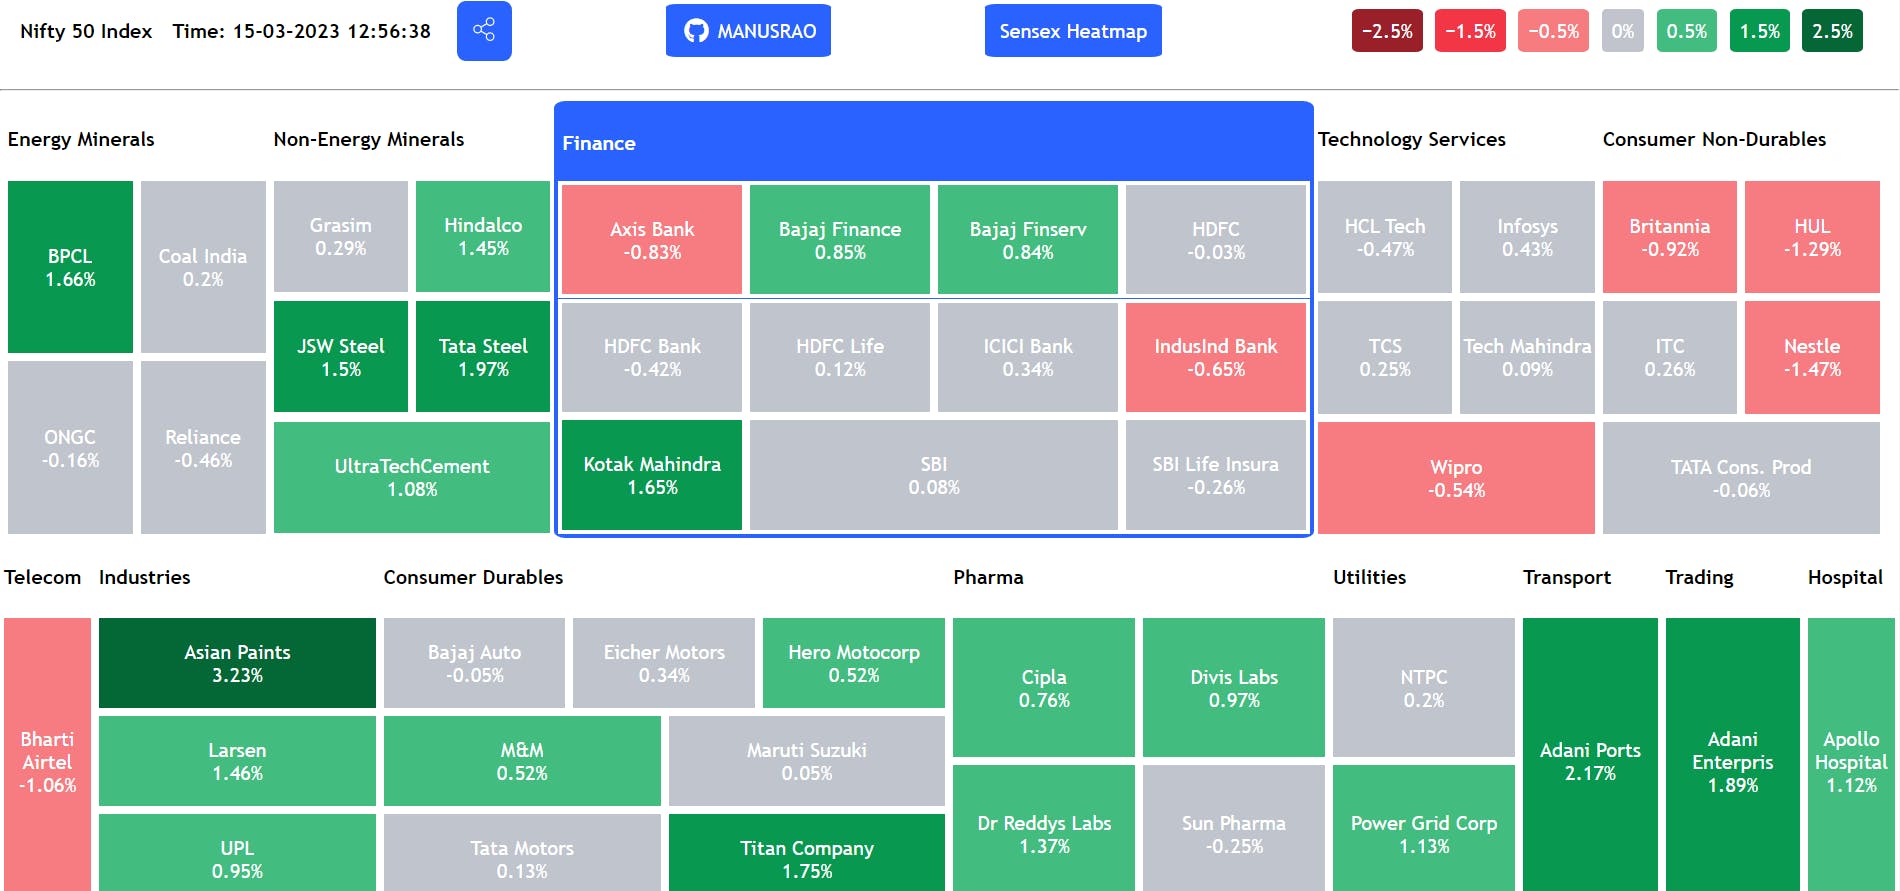
In the world of finance, the ability to visualize market data can be a powerful tool for investors and traders. One popular way of representing financial data is through a heatmap, which can easily display large amounts of information in a visual format. In this blog, we will explore how to create your stock market heatmap using Django and Beautiful Soup 4. With this project, you will be able to track multiple stocks and see how they are performing in real-time, making it a very useful tool for anyone interested in the stock market.
✅Demo of the Project
🔗 Link: https://stockmap.vercel.app/
✅Design of the Project
Let me first explain the design of the project:
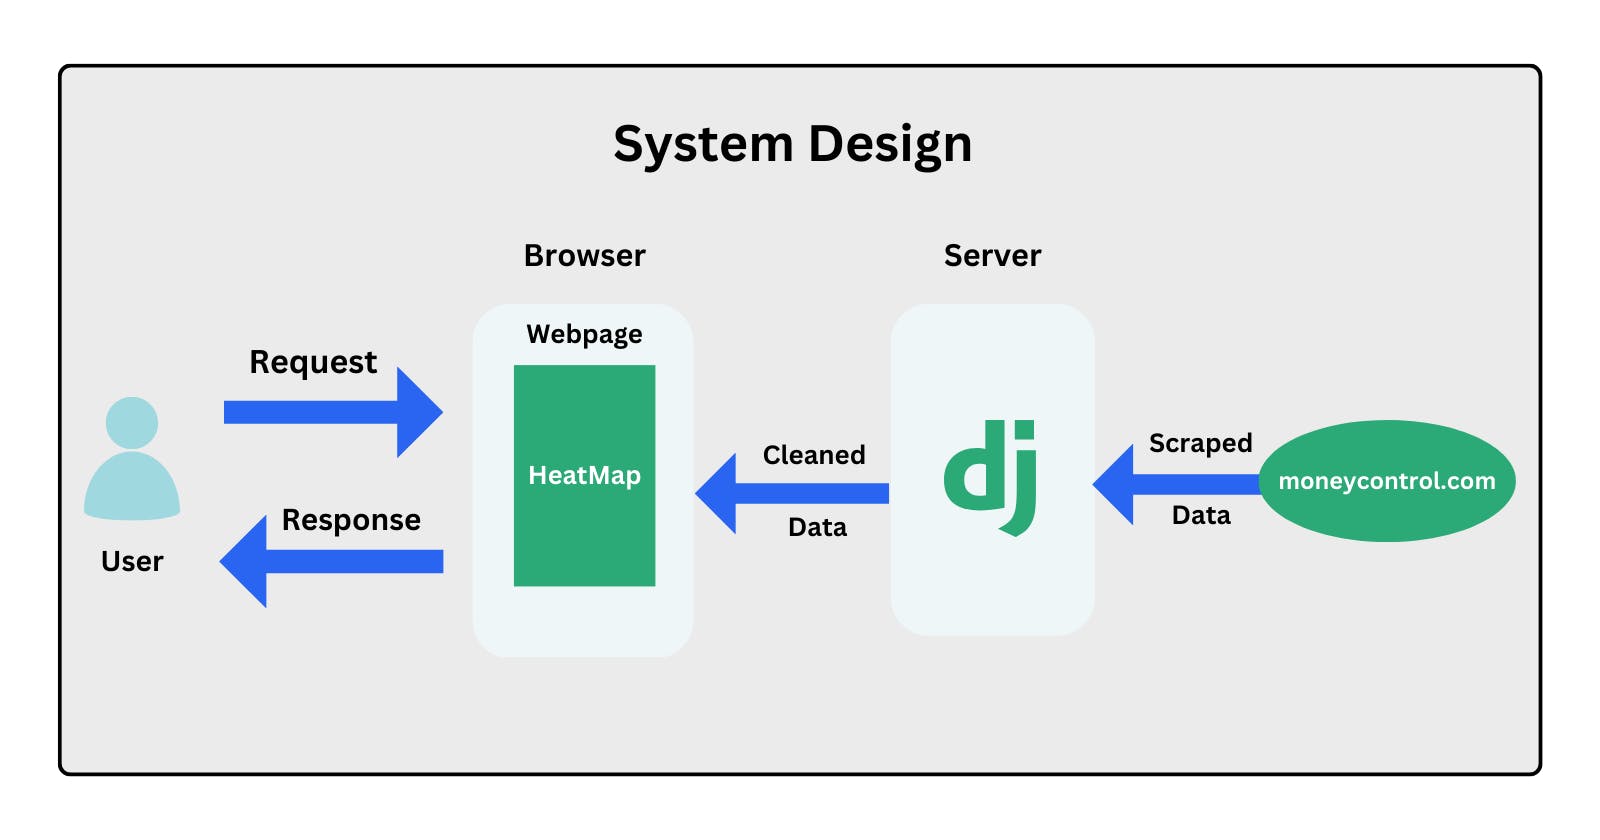
Whenever a request is made to the server, we use the
requestsmodule to get the data from the Moneycontrol website.Then, we use
Beautiful Soup 4to scrape the website.The scraped data is cleaned and passed to our HTML page using the
Djangoserver.Using the obtained data, the webpage is rendered with the necessary styling to get a heatmap.
✅Let's start coding
Server Set up:
First, step up a virtual environment using virtualenv command. In this environment install django and beautifulsoup4 packages using pip command.
virtualenv "envname"         # envname can be of your choice
./envname/scripts/activate # This will activate the Virtual Environment
pip install django         # This will install django
pip install beautifulsoup4 # This will install Beautiful Soup 4
Then, we will start the project and set up a base app that will handle user requests.
django-admin startproject "appname"
python manage.py startapp "baseapp"
Now since the Django app is set up we need to write functions to handle the user requests, so go to views.py file and add a new function. As discussed in the design whenever a request is made to the server, we need to scrape the data. So using the requests module we make a request to the Moneycontrol Website and save the response.
response = requests.get("https://www.moneycontrolcom/stocks/marketstats/index comp.php?optex=NSE&opttopic=indexcomp&index=9")
After we save the response, we use BeautifulSoup4 to parse the response. The Parsed response is then analyzed along with the website by which we can make out that our required data is stored in <table> element with nested <a> in <tr> element. We use the find_all function to find the row elements and use the nested find function to extract the data.
For saving the data, we can use an array of dictionaries where each dictionary is a company along with its details.
# Example company Data
company = {'name': name, 'category': category, 'ltp': ltp,'priceChange':        priceChange, 'percentChange': percentChange,'mcap': mcap}
Since we also need to sort the companies based on their categories we can make some more dictionaries for each category and store each company's data there.
# Example Category Data
category = {'name':'name','class':'name','data':[]}
With the data now collected, we can render the HTML file and the collected data. To render the file, add the following line at the end of the function:
return render(request, 'heatmap.html', context)
As you can see, we have to create a plain html file by the name heatmap.html and place the file in Templates folder. The collected data is passed through a context which itself is a dictionary. Inside the heatmap.html file, we can use Django Templating Engine to render the data. As seen in the code below, we have two loops, one to loop through all the categories and one to loop through all the companies in that category.
<div class="cont">
   {% for d in total_data %}
      <div class="category-container {{d.class}}">
        <h4>{{d.name}}</h4>
        <div class="company-container">
           {% for comp in d.data %}
              <div class="company {{comp.class}}">
                <p>{{comp.name}}</p>
                <p>{{comp.percentChange}}%</p>
              </div>
           {% endfor %}
        </div>
     </div>
   {% endfor %}
</div>
Now, we can set a URL for the user to which he/she can make a request and gather data. For setting the URL, go to the urls.py file and add the following line in the urlpatterns list :
path('heatmap/',views.heatmap,name="Nifty"),
So now whenever a user makes a request to the server with https://domain/heatmap the user will receive the data of the Nifty50 companies.
CSS Styling:
Since heatmaps are structured in a grid-like structure, we will use the CSS-Flex for styling the <div> for each category and its corresponding companies. We can style the page using a separate styles.css file or use Inline CSS, you can choose any of the options. Now, let's add some base styling:
 /* Base Styles */
* {
    box-sizing: border-box;
}
html,
body {
    height: 100%;
    margin: 0;
    font-family: "Trebuchet MS", "Lucida Sans Unicode", "Lucida Grande",
              "Lucida Sans", "Arial", "sans-serif";
}
p {
    margin: 0;
    text-overflow: ellipsis;
    white-space: nowrap;
    overflow: hidden;
}
As seen in the code before, we have a main outer <div> container that contains all the category <div> which in turn contains all the company <div>. So let's write the CSS for each container:
.cont {
    display: flex;
    width: 100%;
    height: 90vh;
    flex-wrap: wrap;
}

.category-container {
    display: flex;
    flex-direction: row;
    flex-wrap: wrap;
    flex-flow: column;
}

.company-container {
    display: flex;
    width: 100%;
    height: 100%;
    flex-wrap: wrap;
}
Since some categories have more companies than others, we will make each container width proportional to the number of companies in that category. Since I have done that already, here's the code:
.consumer {
    width: 20%;
}
.minerals {
width: 14%;
}
.nonMinerals {
width: 15%;
}
.finance {
width: 40%;
}
.tech {
width: 15%;
}
.nonConsumer {
width: 15%;
}
.telecom {
width: 5%;
}
.industry {
width: 15%;
}
.consumer {
width: 30%;
}
.health {
width: 20%;
}
.trading {
width: 7.5%;
}
.hospital {
width: 5%;
}
.power {
width: 10%;
}
.transport {
width: 7.5%;
}
PS: You can change the widths to appeal to your liking.
With categories and their companies arranged we need to style its background color to match the appearance of the heatmap. For that we can use the following CSS classes:
 .negative-high {
 background-color: #991f29;
 }
 .negative-mid {
 background-color: #f23744;
 }
 .negative-small {
 background-color: #f67c81;
 }
 .neutral {
 background-color: #c0c5cd;
 }
 .positive-small {
 background-color: #42bd7f;
 }
 .positive-mid {
 background-color: #099850;
 }
 .positive-high {
 background-color: #046736;
 }
So, in our data whenever we record the percentage of gain or loss for that company we can mention that in the data with the respective class. Adding the class automatically styles the company to match its gain or loss.
Share Feature
With the heatmap now complete, we can add the share feature to download the heatmap as a PNG file for sharing. For that, we are going to use html2canvas.js and canvas2image.js. First, we will set a target element to convert it into <canvas> element and then convert the <canvas> into PNG Image. To implement this we can just add a small <script> tag at the end of the heatmap.html's <body>.
document.getElementById("shareBtn").addEventListener('click',()=>{
     document.getElementById("sensex").style.display = 'none';
     const screenshotTarget = document.body;
     html2canvas(screenshotTarget).then((canvas) => {
     return Canvas2Image.saveAsPNG(canvas);
     });
     document.getElementById("sensex").style.display = 'flex';
 })
✅Wrap Up
And that's it, You have implemented a heatmap that dynamically scraps a website and displays the data in a visually appealing format that aids in swift decision-making. Also, feel free to modify my code to your liking, you can add custom CSS to make it look cooler.
If you feel stuck at any point, go through my Github Repo.
If you want to connect with me, you can find me on Twitter.
Happy coding!!